Some authors are consistently better than others
26th July 2017I have a potentially heretical proposition: performance is not random. This might be slightly controversial given the influence of books like A Random Walk Down Wall Street by Burton Malkiel, which argues that investors gravitate towards the mean. It also goes against the adage that “any monkey” could beat Wall Street by throwing darts at a dartboard.
But this isn’t the only way to look at the market. It’s actually quite simple to create a portfolio of random recommendations to show that some stockpickers consistently beat the random portfolio’s performance.
I work with TIM, a platform for thousands of analysts on the sell side to provide trades to the buy side. It gives me unique access to track performance across the whole market, with over a decade of historical recommendations. Here’s what I found: average idea performance beats both the random portfolio and the relevant benchmark.
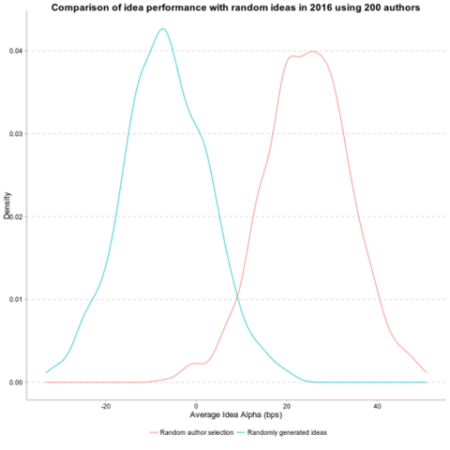
Given that aggregate performance is positive and not random, this means some authors are consistently better than others. The portfolio of randomly selected authors outperforms the portfolio of randomly selected ideas by around 25 bps per idea. And this outperformance is consistent over time: authors in the top quintile in year 1 have a greater than 30% chance of being in the top quintile two years later. (If there were no author persistence, only 20% of authors should remain in the top quintile.) This holds true for underperformers as well: Authors in the bottom quintile have a 28% chance of being in the bottom quartile two years later.
![]()
So while the aggregate performance is of course the portfolio average, some authors consistently drag that performance up, and some consistently drag it down. The advantage lies in knowing who falls in which camp.
TIM can be thought of as a recommendation engine for investment managers, using statistical tools to see who is consistently valuable, what the sources of that value are, and which investment managers are the best match. This is a proven concept. Amazon and Netflix have recommendation engines. For Amazon, discovering and reporting what purchases go together helps solve problems for customers and thereby increase revenue. For Netflix, analyzing subtle patterns to identify movie preferences helps customers discover shows they didn’t know they would like, which increases stickiness, and so increases revenue. Both companies have taken something hard to quantify or define – what is taste? – and made it usable.
Machine learning techniques uncover sometimes unexpected kinds of “similarity”. If a firm can identify a user as a certain type of user, or a product as a certain type of product, it can make recommendations that help its customers while increasing usage. These techniques observe stated or implicit preferences and build constellations of interests based on actual interactions. Contrast this with difficult-to-maintain lookup tables — essentially lists of items that go together. If you buy a hammer, for example, it might be obvious to recommend nails, but you might also need a tape measure, a tool belt…or sunscreen.
Identifying clusters of overperforming or underperforming authors, or of investment managers in search of specific kinds of alpha (by region, sector, or strategy) allows TIM to predict the authors who perform well and overweight their future recommendations. It also allows us to understand what attributes of author ideas influence their outperformance, and match them to investment managers who can most benefit.
Random ideas in blue shows negative performance. Randomly selected authors shows average positive performance of around 25 bps per idea. These are residual returns, so differences in return are after-market effects.
Top quintile has a 30% chance to remain in top quintile two years later (versus 20% if performance is random) versus a 14% chance of falling to the bottom. Top-performing contributors are over twice as likely to be top performers two years later as they are to fall to the bottom of the scale. Performance is not random. Contributors have an average hit rate of 62%, meaning that contributors outperform their benchmarks over 62% of the time.
Overall market performance is by definition average performance, but that does not mean it is random. Some market participants generally outperform the market over time. A deep history of investment recommendations and new statistical tools help reveal the patterns behind this consistent outperformance.